Description of the Control
Graphic control based on the Morris.js library. It allows to show responsive graphics with an attractive design in a simple way. The types of graphs available are: Area, Line, Bar and Dona.
Compatibility
Web
Using the control
Open Extensibility Catalog and go to the Web section through the left side menu.
Select the MorrisChart control and then install.(See Extensibility Catalog documentation if you have questions about the process of installing controls.)
During the installation process it is recommended to import the example XPZ that comes with the control.
When importing the example XPZ of the User Control in the Ignia / Controls / MorrisChart route, an example Web Panel with several graphs and the SDT with the data structure for each type of graph is created.
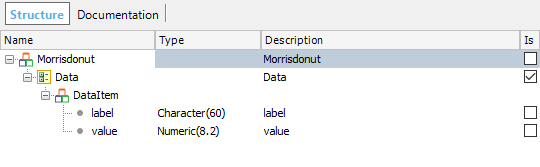
Data structure for the Dona.
Consists of a collection of label tags and values.
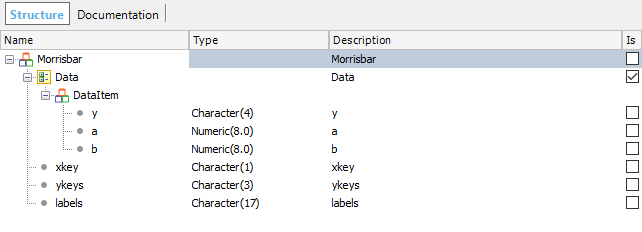
Data structure for the Area, Line, Bar.
These graphs, use similar data structures, the fields are the following:
- xkeys: defines the name of the variable present in the SDT under the DataItem node that contains the values of the X axis
Example
xkey = 'y'
- ykeys: defines the name of the variable present in the SDT under the DataItem node that contains the values of the Y axis.
Example
ykeys = 'a,b'
- labels: define the labels for each of the Y axis series.
Example
labels = 'Series A,Series B'
For a better understanding, the user can review the example Data Providers that come with the control, which are associated to the data structures of the graphics.
Properties
| Property/ Chart |
Donate |
Bar |
Line and Area |
Description |
| Chart Type |
x |
x |
x |
Graph type. |
| Data |
x |
x |
x |
Data to be plotted. |
| Colors |
x |
x |
x |
An array of strings that contains colors in hexadecimal. |
| Resize |
x |
x |
x |
True to enable automatic resizing when the container element resizes. |
| Grid |
|
x |
x |
True to enable the drawing of the grid's horizontal lines. |
| Grid Text Color |
|
x |
x |
Color of the axis labels (default # 888). |
| Grid Text Size |
|
x |
x |
Size of the axis labels (default: 12). |
| Grid Text Weight |
|
x |
x |
Font Weight for the source of the axes labels (default: normal). |
| Point Size |
|
|
x |
Diameter of the series points, in pixels. |
| Point Fill Colors |
|
|
x |
Colors for the series point. By default uses the same values of the Colors property. |
| Point Stroke Colors |
|
|
x |
Colors for the contours of the points of the series (by default #ffffff). |
| Hide Hover |
|
x |
x |
"No" to always show the legend. "Yes" to show only the legend with the hover cursor event. "Always" to never show the legend. |
| Axes |
|
x |
x |
False to deactivate the drawing of the axes. |
| Line With |
|
|
x |
Width of the series lines, in pixels. |
| Fill Opacity |
|
|
x |
Change the opacity of the fill color of the area. Accepts values between 0.0 (for fully transparent) and 1.0 (for completely opaque). |
| Post Units |
|
|
x |
Value (for exemple: '%') to add a postfix to all labels on the Y axis. |
| Pre Units |
|
|
x |
Value (for exemple '$') to add a prefix to all labels on the Y axis. |
| Parse Time |
|
|
x |
False to bypass the date and time analysis for X-axis values. |
| YMax |
|
|
x |
Maximum value for the Y axis. |
| YMin |
|
|
x |
Minimum value for the Y axis. |
| Behave Like Line |
|
|
Solo Área |
True to overlay the areas on top of the others instead of extending them. |
| Stacked |
|
x |
|
True to draw vertically stacked bars. |
Note: The color property differs for each type of graphic:
- Dona: colors for the different sections of the dona.
- Bar: colors of the bars.
- Line: colors of the lines.
- Area: colors of the areas.
Execution
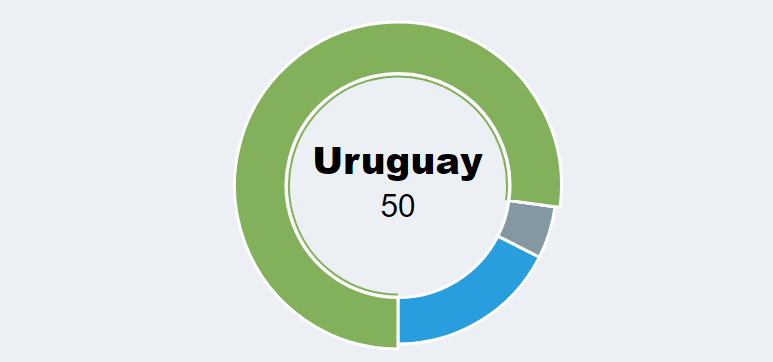
Dona Chart
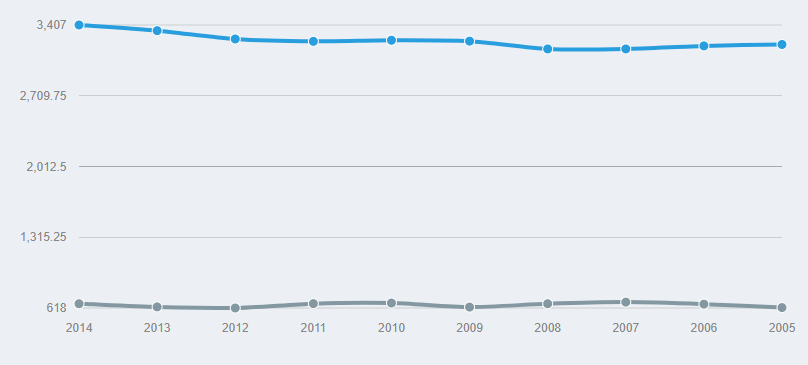
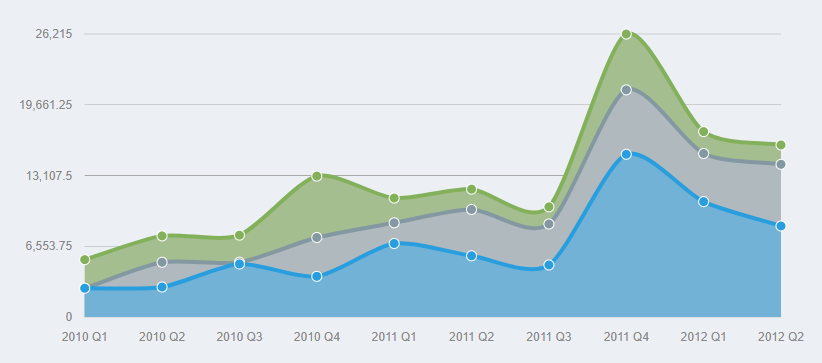
Area Chart
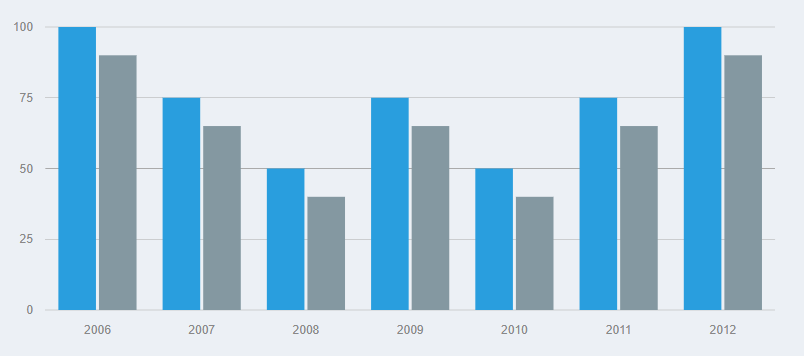
Bar Graph
Line Graph